Subscription Business Metrics: Growth, MRR & Churn Insights
Unlock growth with our guide to subscription business metrics. Learn to track, analyze, and optimize MRR, Churn, and LTV with practical examples.
Subscription metrics are the numbers that tell you if your recurring revenue business is healthy or on life support. Think of key indicators like Monthly Recurring Revenue (MRR) and Customer Churn—these aren't just data points; they're the pulse of your company, showing you everything from financial stability to customer satisfaction.
Why Subscription Metrics Are Your Business Dashboard
Trying to run a subscription company without tracking the right metrics is like flying a plane blind. You might be moving, but you have no clue about your altitude, speed, or whether you're about to run out of fuel. That's what your metrics are: they're the instruments on your business dashboard, giving you the real-time feedback you need to navigate growth and avoid disaster.
Let's use a simpler analogy: a car on a road trip. A few gauges are absolutely critical to getting where you're going.
- Your Speedometer is your MRR: It tells you exactly how fast your revenue is growing each month. Are you accelerating or stalling out?
- Your Fuel Gauge is your Churn Rate: This shows you how quickly you're burning through customers. A high churn rate means you're leaking fuel and won't make it far.
- Your Engine Temperature is your LTV:CAC Ratio: This one tells you if your growth is sustainable. If the engine is overheating (your acquisition costs are too high compared to customer value), you're headed for a breakdown.
Without keeping a close eye on these, you're just guessing, hoping you don't run out of gas or drive straight off a cliff.
The Story Behind the Numbers
These metrics do more than just spit out numbers; they tell the story of your business. They reveal how strong your customer relationships are, how much people truly value your product, and whether your financial foundation is solid or shaky. Every big decision, from your marketing budget to your next feature release, should be guided by the story these numbers are telling.
This map here shows how everything is connected—revenue, customers, and product all feed into each other.
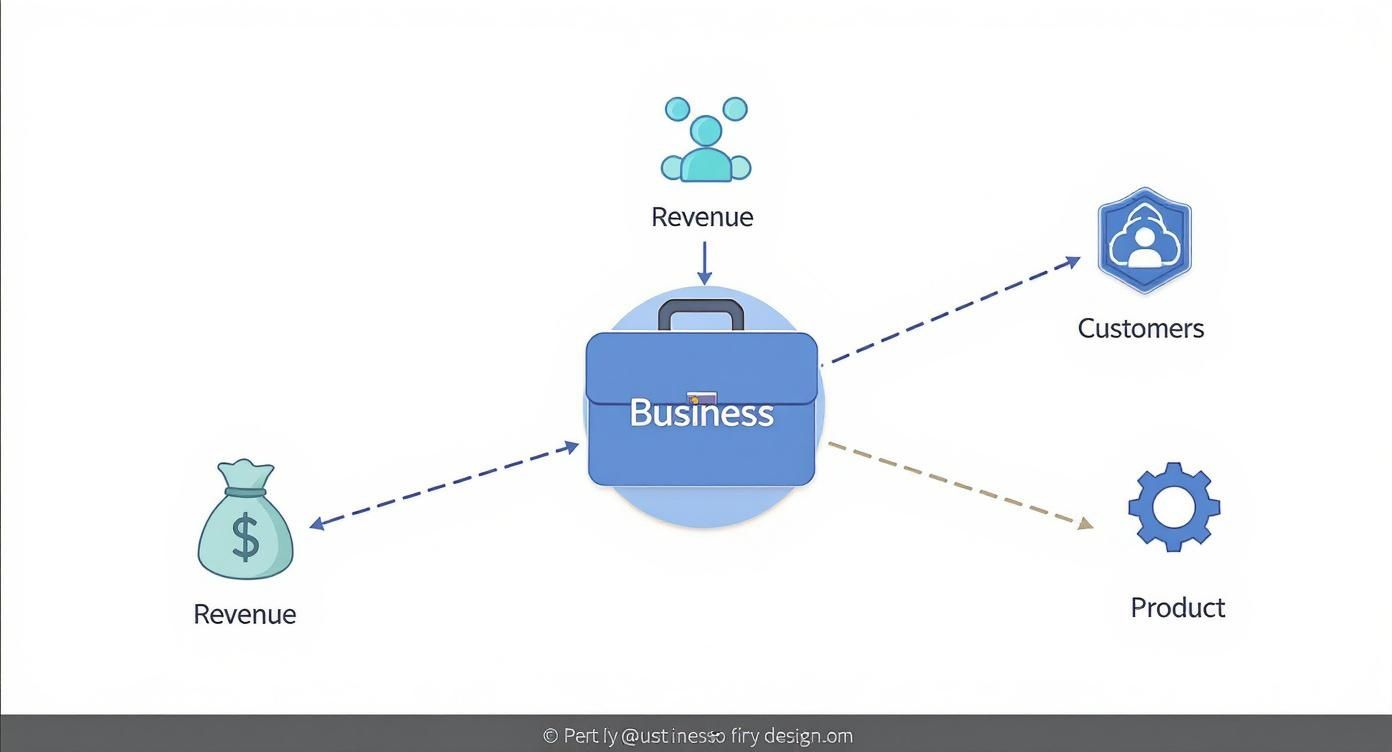
As you can see, a healthy subscription business isn't just about making money. It's about striking a delicate balance between bringing in revenue, keeping customers happy, and delivering a product they can't live without.
This model isn't just a trend; it's a massive shift in how business is done. The global subscription economy was pegged at around USD 492.34 billion in 2024 and is expected to grow at a compound annual rate of 13.3%. Why? Because predictable revenue and deep customer relationships are a powerful combination. You can dig into the full subscription economy market report for a closer look.
To truly understand your business's health, it helps to group your metrics into a few core categories. These four pillars give you a complete picture, ensuring you're not just looking at one piece of the puzzle.
The Four Pillars of Subscription Health
| Metric Category | What It Measures | Key Questions Answered |
|---|---|---|
| Revenue Growth | The speed and consistency of your income streams. | Is our revenue growing? How quickly? Is that growth sustainable? |
| Customer Health | The loyalty and satisfaction of your customer base. | Are we keeping our customers? Are they happy with the service? |
| Unit Economics | The profitability of each individual customer. | Are we making money on each customer we acquire? How much? |
| Cash Flow | The flow of money into and out of the business. | Do we have enough cash to operate and invest in growth? |
By monitoring metrics across these four areas, you get a holistic view that prevents blind spots and helps you make smarter, more balanced decisions for long-term success.
Once you get a handle on these metrics, you stop reacting to problems and start building a proactive strategy. You'll go from guessing what customers want to knowing. Instead of just hoping for growth, you'll have a clear map to get there. Consider this guide your instruction manual for reading that dashboard.
Think of Monthly Recurring Revenue (MRR) as the heartbeat of your subscription business. It’s not just a snapshot of your cash flow for a given month; it’s the predictable, recurring revenue you can reliably expect from all your active subscribers.
This predictability is the magic of the subscription model. Instead of dealing with the lumpy, unpredictable revenue of one-off sales, you get a steady, measurable stream of income. Tracking MRR gives you a clear, real-time pulse on the financial health and growth trajectory of your company. It tells you if you're speeding up, slowing down, or stalling out.

A good dashboard doesn't just show you a single MRR number. It breaks it down into its core components, telling a much richer story about why your revenue is changing. Understanding these individual streams—like new business, expansion, and churn—is how you truly diagnose the health of your revenue engine.
The Anatomy of MRR Growth
Your total MRR is just the headline. The real story is in the pieces that cause it to move up or down each month. We call the sum of these changes Net New MRR. Let’s break down the moving parts.
- New MRR: This one’s simple. It’s all the recurring revenue you gained from brand-new customers who signed up this month.
- Expansion MRR: This is where the real magic happens. Expansion MRR is the additional revenue you generate from your existing customers when they upgrade to a pricier plan, add more seats, or purchase an add-on. This is the most efficient form of growth you can find.
- Contraction MRR: The flip side of expansion. This is the revenue you lose when existing customers downgrade to a cheaper plan or reduce the number of users on their account.
- Churned MRR: This is the total monthly revenue you lose when a customer cancels their subscription entirely. It's a direct subtraction from your revenue baseline.
Your Net New MRR is the ultimate indicator of your growth velocity. A positive number means you're growing; a negative one means you're shrinking, even if new customers are signing up. The formula is: (New MRR + Expansion MRR) - (Contraction MRR + Churned MRR).
How to Calculate MRR Correctly
On the surface, calculating your base MRR seems straightforward. You just multiply your total number of active subscribers by their average monthly fee.
Let's use a small SaaS company, "TaskFlow," as an example. They have two plans:
- Solo Plan: 100 customers paying $10/month
- Team Plan: 50 customers paying $50/month
Here’s the math: (100 customers * $10) + (50 customers * $50) = $1,000 + $2,500 = $3,500 MRR
Simple, right? But this is where companies often make mistakes. The golden rule of MRR is to exclude all non-recurring revenue. This means one-time setup fees, professional service charges, and any variable usage fees have no place in your MRR calculation. Including them will inflate your numbers and paint a dangerously inaccurate picture of your predictable income.
For a complete guide, check out our article on the monthly recurring revenue formula and its common pitfalls.
Ultimately, MRR is more than just a metric. It's the foundation for understanding your business's health and momentum. It drives your decisions on everything from marketing budgets to hiring plans, making it the most critical gauge on your company dashboard.
Plugging the Leaks in Your Revenue Bucket
Getting new customers is the glamorous side of growing a business. But what happens if they’re slipping out the back door as fast as new ones are coming in? The best way to think about this is the classic "leaky bucket" analogy.
Picture your business as a bucket you’re trying to fill with water. Every new customer is more water pouring in from the tap, and it feels great watching that water level rise. But churn is like having holes in the bottom of that bucket, silently draining away all your hard work. If you don't plug those leaks, you'll find yourself running the tap faster and faster just to keep the water level from dropping. That's a surefire path to burnout.
This is exactly why getting a handle on churn is one of the most important things you can do for your subscription business. It shifts the focus from just acquiring customers to keeping them—and retention is the real engine of long-term, sustainable growth.
Customer Churn Versus Revenue Churn
It’s easy to lump all churn together, but not all churn is created equal. You absolutely need to track two different types to understand what’s really going on.
- Customer Churn Rate: This is the most straightforward one. It tells you the percentage of customers who bailed on their subscription during a certain period. Think of it as a direct pulse check on customer happiness and how "sticky" your product is.
- Revenue Churn Rate (MRR Churn): This metric gets down to the financial reality. It measures the percentage of monthly recurring revenue you lost from those cancellations. This is about the cold, hard cash impact.
So, why bother splitting hairs? Imagine you lose ten customers this month. If they were all on your starter plan at $10 a month, your revenue churn is $100. But what if one of those ten was an enterprise client paying $1,000 a month? Your customer churn number is the same, but the financial hit is ten times worse. You need both metrics to see the full story.
Strategies to Reduce Voluntary Churn
Voluntary churn is when a customer makes a conscious choice to hit the "cancel" button. To fight this, you have to be relentless about delivering value and creating an experience they can't imagine leaving.
One of the biggest culprits here is when customers feel your product is no longer a "must-have." In fact, studies show that for software subscriptions, 36% of people cancel simply because they don't feel they need the product anymore, and another 27% jump ship for a free alternative. You can dig into more industry trends by checking out the latest subscription statistics. This really drives home the point that you're in a constant battle to prove your worth.
A great place to start is by nailing your onboarding. A user who "gets it" right away and weaves your product into their daily routine is far less likely to churn. Your mission is to guide them to that "aha!" moment as quickly as humanly possible.
Churn is often a lagging indicator of a problem that started weeks or months ago. By the time a customer cancels, the damage has already been done. Proactive engagement is the only way to get ahead of it.
Next, you have to get proactive with customers who seem to be drifting away. Use your analytics to spot users whose engagement is dropping. Are they logging in less? Have they stopped using key features? Don't just sit back and wait for the cancellation email. Reach out with a helpful tip, announce a new feature you think they'd love, or send a personal check-in. To really get inside your customers' heads, it's worth exploring the most common subscription cancellation reasons to see what truly motivates them to leave.
Fighting Involuntary Churn with Dunning Management
Not every lost customer wanted to leave. Involuntary churn is the silent killer—it happens when a payment fails, usually due to something as simple as an expired credit card, insufficient funds, or a bank decline. These are customers who were perfectly happy to keep paying you but were lost to a technicality.
The good news? This is one of the easiest leaks in your bucket to plug.
The solution is a process called dunning management. It's basically an automated system for chasing down failed payments. A simple dunning workflow looks something like this:
- Pre-Dunning Emails: Send a friendly heads-up a week or two before a customer's card is about to expire.
- Grace Period: Don't just shut off access the second a payment fails. Give them a few days to sort things out.
- Smart Retries: Automatically try the payment again a few times over the next week. You'd be surprised how often a retry on a different day or time works.
- Clear Communication: Your failed payment emails should be crystal clear and helpful, not accusatory. Provide a simple, one-click link to update their billing info.
By putting these simple strategies into play, you can patch up both voluntary and involuntary churn, making sure the revenue you work so hard to bring in actually stays in the bucket.
The Profitability Equation: LTV and CAC

Here's the million-dollar question every subscription business owner has to answer: are you paying more to win customers than they're actually worth? This isn't just some academic exercise; it’s a direct test of whether your business model can actually survive.
The answer is found in the relationship between two of the most critical metrics you'll ever track: Customer Lifetime Value (LTV) and Customer Acquisition Cost (CAC).
Think of it like building a house. Your CAC is what you pay for the land and foundation. Your LTV is the total value you'll get from that house over its entire life. If you spend more on the foundation than the finished house will ever be worth, you're not building a business—you're just digging a financial hole.
This powerful duo gives you a straightforward way to measure profitability. By comparing what you spend to get a customer against what you earn from them, you can finally see if your growth is real and sustainable, or just an expensive illusion.
Calculating Your Customer Acquisition Cost
Before we can see how these two metrics work together, you have to know how to calculate them. Let's start with Customer Acquisition Cost (CAC), which is simply the total cost of all your sales and marketing efforts to land one new customer.
The formula looks easy enough:
Total Sales & Marketing Expenses / Number of New Customers Acquired
But the devil is in the details. Your "Total Sales & Marketing Expenses" needs to cover everything you spend to get people to sign up:
- Ad spend: Money you're putting into Google Ads, social media campaigns, or any other paid channel.
- Salaries: The wages for everyone on your marketing and sales teams.
- Tools: Costs for your CRM, email marketing platform, analytics software, and so on.
- Content creation: Expenses for writing blog posts, shooting videos, or hosting webinars.
For example, if you spent $10,000 on sales and marketing last month and brought in 100 new customers, your CAC is $100. That's the price of admission for each new subscriber. For a deeper look, our guide on user acquisition for mobile apps breaks down strategies that directly impact this cost.
Determining Customer Lifetime Value
Next up is Customer Lifetime Value (LTV). This metric forecasts the total revenue you can expect from a single customer over the entire time they stay with your company. It forces you to look beyond that first payment and see the long-term picture.
A simple way to calculate LTV is:
Average Revenue Per Account (ARPA) / Customer Churn Rate
Let's use an example. If your average customer pays you $50 per month (ARPA) and your monthly customer churn rate is 5%, your LTV would be $1,000 ($50 / 0.05). This tells you that, on average, a new customer will generate $1,000 in revenue before they eventually cancel.
Key Takeaway: CAC tells you what you pay to get a customer in the door. LTV tells you how much that customer is worth once they're inside. The real magic happens when you compare the two.
The All-Important LTV to CAC Ratio
Now, let's bring it all together. The LTV to CAC ratio is probably the single best indicator of your business model's long-term health. The calculation is as simple as it gets: LTV divided by CAC.
Using our numbers from before: LTV of $1,000 / CAC of $100 = a ratio of 10:1
This ratio is your profitability scorecard. Here’s a quick guide to what the numbers mean:
- A 1:1 Ratio: This is the danger zone. You’re spending exactly as much to acquire a customer as you’ll ever make from them. You’re just breaking even, with nothing left for profit or covering other business costs.
- Less than 1:1: You're losing money on every single customer you sign up. This is an unsustainable path that needs an immediate course correction.
- A 3:1 Ratio: This is what many consider the "golden ratio" for SaaS and subscription companies. It means you have a healthy, profitable, and sustainable engine for growth.
- Higher than 3:1: A ratio like 4:1 or 5:1 is fantastic. It suggests you might even have room to spend more aggressively on marketing to grow even faster.
Understanding this ratio elevates you from just tracking metrics to making smart, strategic decisions. It gives you a clear framework for optimizing your marketing spend, refining your pricing, and ultimately building a business that can scale successfully.
Unlocking Growth with Advanced Subscription Metrics
https://www.youtube.com/embed/KvPhM_-LLP4
Once you’ve got a handle on the fundamentals—your MRR, churn, and LTV to CAC ratio—you’re ready to graduate from simply monitoring your business’s health to actively steering its growth. This is where advanced metrics come into play. These aren’t just abstract numbers; they are the strategic levers that separate the good subscription businesses from the truly great ones.
Think of it this way: your basic metrics are the vital signs. They tell you if the patient is alive. Advanced metrics are the diagnostic tools that tell you why a particular vital sign is high or low and exactly what you need to do about it. They give you the deep insights needed to make smarter, faster decisions.
Let's dive into a few of these powerful metrics.
Measuring Customer Value with ARPA
First on our list is Average Revenue Per Account (ARPA), which you'll also hear called Average Revenue Per User (ARPU). At its core, ARPA tells you the average amount of revenue you’re bringing in from each of your customers, usually calculated monthly.
The formula itself is clean and simple:
Total MRR / Total Number of Active Customers
But the real magic of ARPA isn't in that single, top-level number. Its power is unleashed when you start segmenting it. You can slice and dice ARPA by pricing plans, sign-up dates (cohorts), or even the marketing channel that brought the customer in. Suddenly, you can answer some mission-critical questions:
- Are customers on our "Pro" plan actually more valuable than those on our "Enterprise" plan over time?
- Do the customers we acquired during our big Q4 promotion stick around and spend more?
- Which marketing channels bring in the big spenders versus the bargain hunters?
By digging into these segments, you can quickly identify your most valuable customer profiles and start investing your resources where they’ll have the biggest impact.
Calculating Your Capital Efficiency with CAC Payback Period
Next up is the CAC Payback Period. This one is crucial because it tells you exactly how many months it takes to earn back the cash you spent to acquire a customer. It's a direct reflection of your capital efficiency—the faster you get your money back, the faster you can pour it back into your growth engine to acquire even more customers.
A long CAC Payback Period acts like a brake on your growth. Even with a fantastic LTV to CAC ratio, a 24-month payback period means you’re funding that customer’s first two years out of pocket before they turn profitable.
Here’s how you figure it out, pulling in your ARPA and Gross Margin:
CAC / (ARPA * Gross Margin)
For most SaaS businesses, the gold standard is a CAC Payback Period of under 12 months. The shorter you can make this cycle, the more self-sufficient your growth becomes, reducing the need for outside funding to keep scaling.
Validating Your Sales Engine with the SaaS Magic Number
Finally, we have the SaaS Magic Number, a metric that gets a lot of attention from VCs and investors for good reason. It measures just how efficient your sales and marketing spending is at creating new recurring revenue. In plain English, it answers the question: "For every dollar we put into sales and marketing, how many dollars of new annual revenue did we get out?"
Advanced Metric Quick Reference
These metrics can feel like a lot at first, so here’s a quick-reference table that boils them down to the essentials. Think of this as your cheat sheet for moving beyond the basics.
| Metric | Simple Formula | What It Tells You |
|---|---|---|
| ARPA | MRR / Total Customers | The average revenue value of each customer account. |
| CAC Payback | CAC / (ARPA * Gross Margin) | How many months it takes to recoup acquisition costs. |
| Magic Number | ((Current Quarter's New ARR - Last Quarter's New ARR) * 4) / Last Quarter's S&M Expense | The efficiency of your sales and marketing engine. |
A Magic Number greater than 1.0 tells investors (and you!) that your sales model is efficient and ready to scale. A number between 0.75 and 1.0 is solid, but anything below 0.75 is a signal to pause and refine your strategy before you pump more money into the machine.
By truly understanding and acting on these advanced metrics, you shift from just watching the numbers to actively shaping them. You’re no longer just a passenger—you’re in the driver’s seat, fine-tuning your business for peak performance and sustainable growth.
Alright, let's get into what really matters: turning all this data into something you can actually use. Knowing your subscription business metrics is half the battle, but making smart decisions based on them is how you win. That’s where a solid metrics dashboard comes in.
This isn't about making fancy charts to impress people. It's about creating one place—a single source of truth—that tells you exactly how your business is doing in a single glance. Think of it as your company's cockpit. It needs to provide clarity, not confusion, so anyone from the CEO down to a new marketing hire can get the answers they need, fast.
Choosing the Right Tools for Your Stage
The right tool for the job really depends on where you are in your journey. A brand-new startup has very different needs than a business that’s scaling up quickly. You wouldn't use a sledgehammer to hang a picture frame, right? Same idea here.
- Early Stage (Just Starting Out): Honestly, a well-organized spreadsheet is your best friend. Something like Google Sheets or Excel is free, flexible, and forces you to get up close and personal with your numbers. When you're manually inputting MRR and customer counts, you develop a gut feeling for the business that you just can't get any other way.
- Growth Stage (Scaling Up): Once you start getting real traction, manually tracking everything becomes a huge pain and a genuine risk. This is when it's time to bring in the pros. Subscription analytics platforms like ChartMogul, Baremetrics, or ProfitWell are lifesavers. They plug right into your payment gateway (like Stripe) and do all the heavy lifting, giving you accurate, deep insights without the manual grind.
A great dashboard doesn't just show you numbers; it tells you a story. It should instantly answer your most important questions: Are we growing? Are our customers sticking around? And is that growth actually profitable?
Designing Your Dashboard for Action
One of the biggest mistakes I see is people trying to cram every metric they can think of onto a single screen. It’s a recipe for analysis paralysis. A better approach is to organize your dashboard based on who's looking at it and how often they're looking.
A Simple Blueprint for Your Dashboard Views
- The Daily Pulse: This view is all about immediate, top-of-funnel activity. You're looking at things like new trials, daily sign-ups, and maybe app downloads. These are your leading indicators that tell you if your marketing and sales efforts from yesterday are working today.
- The Weekly Health Check: Time to check on your core growth engine. Here, you should be tracking Net New MRR, churn rate, and new subscriber growth. This rhythm is perfect for spotting trends—good or bad—early enough to do something about them.
- The Monthly Strategy Session: Now you zoom out to see the big picture. This is where you dig into LTV, CAC, and the all-important LTV:CAC ratio. These are the numbers that inform your long-term strategy, shape your budget, and drive the big decisions.
By creating these tailored views, you give every team what they need. Marketing can obsess over their acquisition channels, while the leadership team gets a clean, high-level summary of the business's overall health. This is how you transform raw data from a noisy distraction into your most powerful strategic weapon.
Your Subscription Metrics Questions Answered

Jumping into the world of subscription business metrics can feel like learning a new language. It’s normal to have a ton of questions. Let's walk through some of the most common ones that pop up and get you the clear, practical answers you need.
What Is a Good MRR Churn Rate?
This is the million-dollar question, and the honest answer is: it depends. There's no magic number that works for everyone because "good" is entirely shaped by who you sell to. But we can definitely set some reliable goalposts.
For B2B SaaS companies that serve small and mid-sized businesses, a monthly MRR churn rate below 1% is a fantastic sign. It signals a sticky product that customers can't live without. On the flip side, B2C subscription services often have a much higher churn, sometimes in the 3-7% range per month. This is just the nature of the beast—consumers have lower switching costs and are more likely to cancel on a whim.
The bottom line is that context is everything. A 3% churn rate might be a five-alarm fire for an enterprise software company but perfectly healthy for a streaming service. Always measure yourself against similar businesses in your specific niche.
How Often Should I Check My Metrics?
Obsessively refreshing your dashboard every hour is a recipe for burnout and "analysis paralysis." You'll end up reacting to noise instead of signals. A much smarter approach is to establish a rhythm for checking different types of metrics.
Here’s a simple schedule that works for most teams:
- Daily Glance: Keep an eye on your leading indicators—things like new trial sign-ups or daily active users. These give you a quick pulse check on your top-of-funnel health without getting lost in the weeds.
- Weekly Review: This is your time to zoom in on core growth metrics. Dig into Net New MRR and your churn rates. You’re looking for trends, not just blips. Did a new feature release impact engagement? Did a marketing campaign move the needle?
- Monthly Deep Dive: Now, zoom out for the big picture. This is when you tackle the heavy hitters like LTV, CAC, and your LTV:CAC ratio. These are the numbers that guide your long-term strategy and get discussed in board meetings.
Can I Calculate LTV for a New Business?
Yes, and you absolutely should. Waiting until you have years of perfect historical data is a mistake—you'd be flying blind for far too long. You can get a solid, actionable projection of your Customer Lifetime Value (LTV) much earlier than you think.
For a new company, the trick is to use your early cohort data. Once you have a few months of operations under your belt, you can calculate an initial churn rate and your Average Revenue Per Account (ARPA). From there, just plug those figures into the standard LTV formula (ARPA / Churn Rate).
This first pass won't be perfectly accurate, of course, but it gives you a crucial baseline to start making informed decisions. LTV is a living metric, not a "set it and forget it" number. You'll want to keep refining it as you collect more data and learn how your customers behave over the long haul.
Ready to turn insights into revenue? Nuxie gives you an AI-powered paywall studio and the analytics you need to actually do something with your metrics. You can design, test, and launch high-converting paywalls in minutes and see your trial-to-paid numbers climb. Start growing with Nuxie for free.