Monthly Recurring Revenue Calculation A Practical Guide
Master the monthly recurring revenue calculation with our guide. Get actionable steps, real-world examples, and proven tips to track and grow your SaaS revenue.
For any subscription business, your Monthly Recurring Revenue (MRR) is more than just a number—it’s the pulse of your company. It gives you a clear, predictable snapshot of the income you can count on every single month.
The simplest way to think about it is by multiplying your total active customers by the average amount they pay you. But to truly understand your financial health and growth trajectory, you have to dig a bit deeper.
Decoding Your Monthly Recurring Revenue

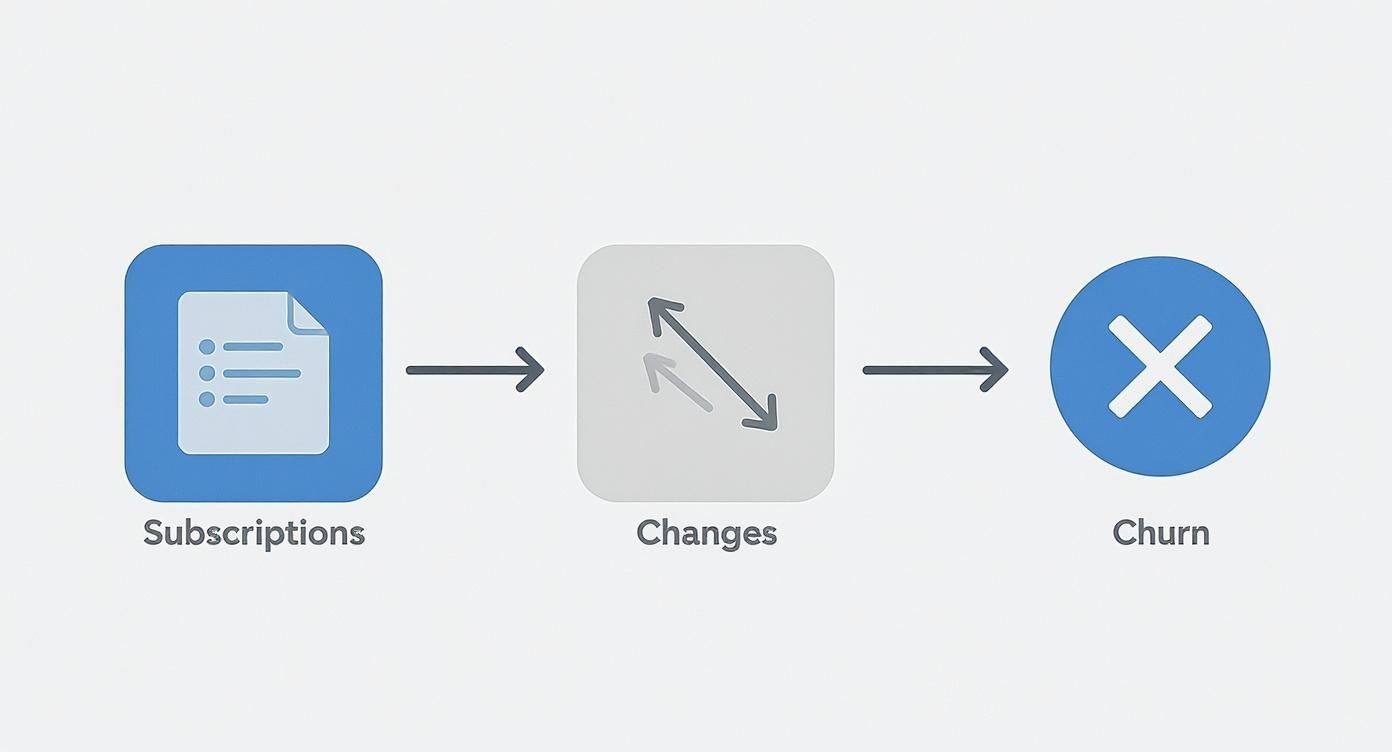
The image above really gets to the heart of why recurring revenue is so powerful. Unlike the rollercoaster of one-time sales, it builds a stable, compounding foundation. This predictability is exactly why founders and investors are so focused on it—it allows for much smarter financial forecasting and strategic planning.
To get a truly accurate monthly recurring revenue calculation, though, we need to move past that simple starting formula. The real story of your business's momentum is told by breaking MRR down into its core components. Each piece reveals something different about where your revenue is coming from and where it might be slipping away.
The Four Pillars of MRR
I like to think of total MRR as a bucket. You have different streams filling it up, but you also have a few leaks. Your job is to measure every stream and plug every leak you can.
Here’s how it breaks down:
- New MRR: This one’s easy. It’s all the revenue you brought in from brand-new customers who signed up this month. This is your primary growth engine.
- Expansion MRR: Often called upgrade MRR, this is the extra cash from your existing customers. Think plan upgrades, buying add-ons, or cross-sells. A high expansion MRR is a fantastic sign that your product is becoming more valuable to your user base over time.
- Contraction MRR: This is the flip side of expansion. It’s the revenue you lose when current customers downgrade their plans or drop an add-on.
- Churned MRR: This is the big one—the total revenue lost when customers cancel their subscriptions completely.
When you track these elements separately, you get a much richer picture. Is your new customer acquisition strong enough to outpace churn? Are your existing customers finding more value and upgrading? This detailed view is the bedrock of any solid revenue optimization strategy.
To make this crystal clear, let's break down these essential elements and what they signal for your business.
The Core Components of Your MRR Calculation
| Component | What It Measures | Business Impact |
|---|---|---|
| New MRR | Revenue from new customers in a given month. | Indicates the effectiveness of your sales and marketing efforts. It's your top-of-funnel growth. |
| Expansion MRR | Additional revenue from existing customers (upgrades, add-ons). | Shows customer satisfaction and product stickiness. Proves you're delivering increasing value. |
| Contraction MRR | Revenue lost from existing customers (downgrades). | Can be an early warning sign of customer dissatisfaction or a mismatch between price and value. |
| Churned MRR | Total revenue lost from customers who cancel their subscriptions. | The ultimate measure of customer attrition. High churn can cripple growth, even with strong new MRR. |
Looking at MRR through this lens transforms a simple calculation into a powerful diagnostic tool. It gives you the insights needed to make smarter, more strategic decisions for sustainable growth.
Key Takeaway: A healthy subscription business doesn't just chase new logos. It's constantly working to boost Expansion MRR while aggressively minimizing both Contraction and Churned MRR.
Getting Your Data Straight for a Flawless MRR Calculation
Your monthly recurring revenue calculation is only as good as the data you feed it. It’s like baking a cake—if your ingredients are off, the final product will be, too. So before you even think about plugging numbers into a formula, you've got to get your data ducks in a row.
First, you'll need a complete picture of all revenue-related activity from the past month. That starts with a simple list of every active subscriber and how much they're paying. This is your foundation.
Pinpointing the Key Metrics
With your baseline established, it's time to dig into the changes that happened over the month. This goes way beyond just counting new customers. You need to track every single fluctuation to truly understand the health of your revenue stream.
Here's what you'll need to isolate:
- New Subscriptions: This one's straightforward—it's the total value of all brand-new customers who came on board.
- Upgrades and Downgrades: You'll want to flag every single time an existing customer moved to a different plan. This is absolutely critical for calculating your Expansion and Contraction MRR.
- Cancellations: You need a list of every customer who churned and the exact amount of revenue you lost with them. A high churn rate is a serious problem, and getting this number is the first step to fixing it. Once you have the data, our guide on how to reduce churn can show you what to do next.
A Quick Word of Warning: Make sure you're excluding all one-time payments. Things like setup fees, consulting gigs, or one-off purchases are not recurring revenue. Including them will give you a dangerously inflated MRR number.
Once you’ve pulled all this together, organize it cleanly in a spreadsheet or your analytics platform. A little organization now will save you from the headache of double-counting or other simple mistakes later.
Don't just look at last month's numbers, either. Analyzing historical data is how you start making smart predictions. Looking back at past trends and seasonal patterns can help you make better calls on everything from pricing to marketing. You might notice, for example, a consistent 10% jump in subscriptions every summer—a powerful insight that could shape your entire promotional calendar. To learn more, check out this great resource on using historical data for revenue projections on phoenixstrategy.group.
A Hands-On Monthly Recurring Revenue Calculation Example
Theory is one thing, but to really get a feel for the monthly recurring revenue calculation, you have to roll up your sleeves and work through the numbers. Let's do just that by looking at a hypothetical month for a SaaS company we'll call "SyncUp."
Imagine SyncUp kicks off the month with a solid $10,000 in MRR. Over the next 30 days, their job is to track every single new customer, upgrade, downgrade, and cancellation. It's the only way to get a true picture of their growth.
This infographic breaks down the typical data points you'll need to pull together for the calculation.
As you can see, a complete MRR picture isn't just about new sales. It’s about tracking the entire customer lifecycle—the good, the bad, and the ugly.
Calculating Each MRR Component
First up, let's look at the new business SyncUp brought in. They had a decent month, signing up 10 new customers to their standard $50/month plan.
- New MRR: 10 new customers × $50/month = $500
Easy enough. But what about their existing customer base? Five of them upgraded from the $50 plan to the $80/month "Pro" plan. For Expansion MRR, we only care about the additional revenue.
- Expansion MRR: 5 upgrading customers × ($80 - $50) = $150
Of course, revenue doesn't always move in the right direction. Two customers on that Pro plan decided to downgrade back to the standard $50 plan, resulting in a revenue loss.
- Contraction MRR: 2 downgrading customers × ($80 - $50) = $60 in lost MRR
And finally, the part no one likes: churn. Three customers on the basic $50/month plan cancelled their subscriptions altogether.
- Churned MRR: 3 lost customers × $50/month = $150
Putting It All Together for Net Growth
Now we have all the pieces to calculate the most telling metric of all: Net New MRR. This number cuts through the noise and shows you the actual growth your business experienced.
Net New MRR = (New MRR + Expansion MRR) - (Contraction MRR + Churned MRR)
So, for SyncUp, the math looks like this:
($500 + $150) - ($60 + $150) = $650 - $210 = $440
SyncUp’s Net New MRR for the month is $440. A positive number here is a fantastic sign of healthy, sustainable growth.
Here's a table to visualize how these components come together to tell the full story.
| Sample MRR Calculation for a SaaS Business | ||
|---|---|---|
| MRR Component | Example Calculation | Result |
| New MRR | 10 new customers × $50 | $500 |
| Expansion MRR | 5 upgrades × ($80 - $50) | $150 |
| Churn MRR | 3 cancellations × $50 | -$150 |
| Net New MRR | ($500 + $150) - $150 | $500 |
Note: The table above simplifies the final calculation by excluding Contraction MRR for clarity, showing a direct path to Net New MRR from the most common components.
In the SaaS world, meticulously tracking MRR this way is non-negotiable. It’s what allows you to maintain a steady growth path, because it directly informs how you forecast sales and allocate resources. In fact, understanding how recurring revenue impacts sales forecasting is a topic Zendesk.com covers in great detail.
By breaking the calculation down like this, you transform a simple revenue number into a powerful diagnostic tool for your business.
Connecting MRR to Your Paywall Strategy
Your monthly recurring revenue isn't just some number you track in a spreadsheet. Think of it as a direct, unfiltered report card on your entire monetization strategy. It tells you exactly how well your subscription funnel and paywall are actually working. When you start connecting revenue data to real user behavior, you stop guessing and start knowing what drives growth.
Let's say you notice a sudden drop in Expansion MRR. Instead of panicking, strong analytics can show you the why. You might find it’s linked to a specific group of users who aren't being shown the right upgrade offers at the right time. That’s a problem you can fix, and you can fix it fast.
Using MRR Trends to A/B Test and Optimize
Imagine a publisher sees their New MRR growth has flatlined. Rather than throwing everything at the wall to see what sticks, they can use this data to run a sharp, focused A/B test on their paywall. Their hypothesis? The current call-to-action is too bland.
- Variant A (Control): "Subscribe for unlimited access."
- Variant B (Test): "Join our community and support independent journalism."
After just one month, the results are in. Variant B didn't just boost new sign-ups; it attracted higher-quality subscribers who were less likely to churn. That’s a double win, positively impacting both immediate and long-term MRR. This is what happens when you use revenue as a strategic tool, not just a historical report.
You can learn more about designing effective paywalls that convert by reading our in-depth guide.
Visualizing this data is key. A clean dashboard, like this example from Stripe, brings it all together.
This kind of view lets you instantly spot trends in new business, churn, and upgrades. It makes the connection between your paywall's performance and the company's financial health crystal clear.
Pro Tip: Set up automated alerts for when your MRR growth rate slows down. This gives you a head-start to launch a retention campaign or test a new offer before a small dip turns into a serious problem. You’re essentially turning a reactive metric into a proactive growth engine.
Ultimately, tying your monthly recurring revenue calculation to your paywall strategy closes the loop. It ensures every single design choice, every word of copy, and every new offer is measured by its real financial impact, paving the way for truly sustainable growth.
Common MRR Calculation Mistakes to Avoid

A solid monthly recurring revenue calculation is the foundation for any reliable financial forecast. But it’s surprisingly easy to get it wrong. Even experienced teams can fall into common traps that skew the numbers, leading to some truly misguided business decisions. The key is to be brutally honest about what counts as recurring revenue—and what doesn't.
The biggest and most common mistake? Lumping one-time payments into your MRR. This includes things like implementation fees, consulting projects, or paid training sessions. It's real money, absolutely, but it's not recurring. Mixing it in gives you a false sense of security and a dangerously inflated view of your business's health. You have to track it separately.
Overlooking Discounts and Prorated Charges
Another pitfall I see all the time is how teams handle discounts. Let's say a new customer signs up for your $100/month plan but has a 25% discount for the first three months. For that period, their contribution to your MRR is $75, not the full $100. It’s that simple—you can only count the cash you’re actually set to collect.
Prorated charges for mid-month signups can also trip you up. If that same customer joins on the 15th of the month, you can only recognize $50 of MRR for that first partial month. These might seem like small details, but ignoring them leads to an overstated revenue figure. It’s a painful surprise when that number corrects itself downward the following month.
Key Takeaway: True MRR only includes the normalized, predictable revenue you can confidently expect every single month. One-off fees, temporary discounts, and transaction costs have no place in this calculation.
A Mini Case Study in Misreading Churn
I once worked with a B2B SaaS company that was patting itself on the back for its low churn rate. The only problem was, their numbers were wrong. They were calculating churned MRR based on the discounted rate a customer was paying when they left, not the full subscription value.
This one small error had a ripple effect:
- It artificially deflated their Churned MRR, making customer retention seem much healthier than reality.
- It completely masked the true revenue impact of losing a customer, since the full price they would have eventually paid was never factored in.
Once we adjusted their monthly recurring revenue calculation to reflect the full, non-discounted value of every lost subscription, the picture became much clearer—and a lot more concerning. That dose of reality was exactly what they needed. It prompted a serious investment in a customer retention strategy that finally got their growth back on track.
Answering Your Top MRR Questions
When you start digging into monthly recurring revenue, a few common questions always pop up, especially when you're dealing with anything more complex than a simple monthly plan. Getting the details right is crucial for accurate reporting and making smart business moves.
Let's clear up a couple of the most frequent sticking points I see.
How Do I Handle Annual Subscriptions in My MRR Calculation?
This is probably the number one question I get. Someone pays you $1,200 upfront for a year-long subscription. It’s tempting to count that full amount in the month you made the sale, but that would be a huge mistake for your MRR.
The key is to normalize that annual payment into a monthly figure. You simply take the total amount and divide it by the number of months in the contract.
The Right Way: $1,200 / 12 months = $100 in MRR for every month of that subscription's term.
Doing it this way gives you a true, stable picture of your company's growth. It smooths out the big revenue spikes and drops that would otherwise make your monthly performance look incredibly volatile, which is the last thing you want when trying to track real progress.
What's the Real Difference Between MRR and ARR?
Think of MRR and ARR (Annual Recurring Revenue) as two different lenses for looking at your business's health. They're related, but they tell you different things and are used for different purposes.
- MRR (Monthly Recurring Revenue) is your on-the-ground, tactical view. It’s what you use to see how you're doing right now. Did that marketing campaign last month work? Is churn ticking up? MRR gives you the immediate feedback you need.
- ARR (Annual Recurring Revenue) is your 30,000-foot strategic view. You get it by multiplying your MRR by 12. This is the number investors and your board want to see. It speaks to the overall scale, stability, and long-term trajectory of the business.
Basically, if your business primarily sells month-to-month plans, you'll be obsessed with MRR. If you're a B2B SaaS company closing big annual or multi-year deals, ARR becomes your North Star for high-level planning. You really need both for a complete picture.
Ready to turn your MRR insights into action? Nuxie is an AI-powered paywall studio that helps you design, target, and launch high-converting paywalls in minutes, without needing to ship an app update. Start optimizing your subscription revenue today by visiting https://nuxie.io.