Understanding Your Churn Rate Subscription Metrics
A complete guide to your churn rate subscription metrics. Learn to calculate, diagnose, and reduce customer churn with actionable strategies for growth.
Subscription churn is the rate at which you lose subscribers. Think of it as a leak in a bucket. If you’re pouring new customers in the top but they're draining out the bottom just as fast, you'll never actually fill it up. That's why managing your churn rate is one of the most critical parts of building a sustainable subscription business.
What Is Subscription Churn Rate and Why It Matters
Let's stick with that bucket analogy for a second. Your subscription app is the bucket, and your goal is to fill it with recurring revenue. Churn is the hole in the bottom.
If that hole is too big, you're forced to spend all your time and money just pouring more water in to keep the level from dropping. You're stuck on an acquisition treadmill, barely treading water. A high churn rate is a direct signal that something is wrong—with your product, your pricing, or the value you're delivering.
On the flip side, a low churn rate is a powerful sign of product-market fit. It means customers are happy, they're sticking around, and your business model is actually working.
Understanding the Two Faces of Churn
But just knowing how many customers you lose isn't the full story. To really understand the health of your business, you need to look at churn from two different angles: its impact on your customer count and its impact on your revenue.
This is where we split churn into two distinct types:
- Gross Churn: This is the most direct measure of loss. It’s the total percentage of customers (or monthly recurring revenue) that you lost during a specific period. It's the raw size of the leak in your bucket.
- Net Churn: This metric gives you a much more nuanced view because it accounts for revenue growth from your existing customers—what we call expansion MRR. It takes your gross revenue churn and subtracts any revenue you gained from upgrades or add-ons.
Getting your Net Churn low, or even negative, is the holy grail. It means the increased spending from your loyal customers is more than making up for the revenue you lose from cancellations. That's how you unlock truly exponential growth.
A healthy subscription business isn't just focused on acquiring new customers, but on delivering so much value that existing ones stay and grow. Your churn rate is the ultimate report card on how well you're achieving that goal.
This relentless focus on retention has never been more important. The subscription economy has proven incredibly durable, growing 4.6x faster than the S&P 500 over the past decade.
What's even more interesting is that average churn rates actually dropped to 5.4% in 2023. That’s a major improvement from before the pandemic, suggesting that consumers are more committed than ever to the services they genuinely find valuable. You can dig into more of these subscription economy trends to see what they mean for your app.
How to Calculate Gross and Net Churn Accurately
To really get a handle on your app's health, you need to look past a vague sense of "losing users" and dig into the actual numbers. The two most important metrics for any subscription business are Gross Churn and Net Churn. They tell two different but equally critical stories about your customer base and revenue.
Think of it this way: Gross Churn shows you how many customers are walking out the door, while Net Churn shows you the financial impact of those departures after you account for the extra money your loyal customers are spending.
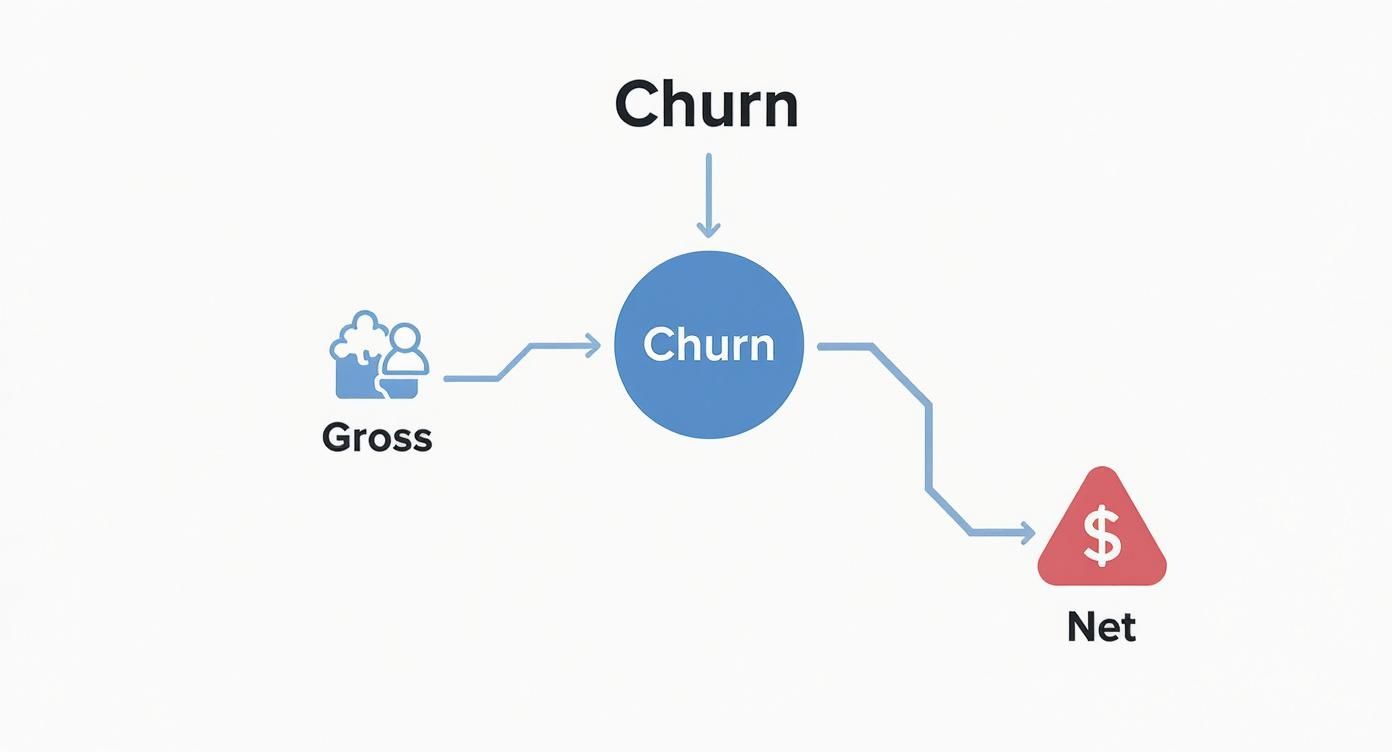
As the infographic makes clear, Gross Churn is the leak in your bucket. Net Churn tells you whether you're managing to pour more water in from existing customers faster than it's leaking out. Getting this distinction right is the bedrock of a solid growth strategy.
Calculating Gross Churn Rate
Gross Churn is the purest measure of customer attrition. It’s a straightforward percentage of subscribers who canceled during a given period (usually a month). This metric is your reality check—it tells you exactly how many customers you failed to keep, with no other financial factors to soften the blow.
The formula is as simple as it gets:
Gross Churn Rate = (Number of Canceled Subscribers in Period / Total Subscribers at Start of Period) x 100
Let's put this into practice with a quick example.
- Imagine you run a fitness app and start April with 1,000 paying subscribers.
- Over the month, 50 people cancel their subscriptions.
Plugging that into the formula, you get:
(50 Canceled Subscribers / 1,000 Starting Subscribers) x 100 = 5%
Your Gross Churn for April is 5%. That's your baseline. It's the raw percentage of your user base you lost. While it’s a vital sign of your app's health, it doesn't paint the full financial picture.
Calculating Net Churn Rate
This is where things get more interesting—and more insightful. Net Revenue Churn measures the financial damage from cancellations after factoring in any revenue growth you generated from your remaining customers. This growth, known as expansion revenue, comes from things like plan upgrades, add-on purchases, or feature unlocks.
Here’s the formula for Net Revenue Churn:
Net Churn Rate = (Churned Revenue - Expansion Revenue) / Starting Revenue x 100
Let's stick with our fitness app example to see how this plays out.
To make it tangible, we'll run through the calculations for Gross and Net Churn side-by-side. This table shows exactly how expansion revenue changes the story.
Gross Churn vs Net Churn Calculation Examples
| Metric | Gross Churn Calculation | Net Churn Calculation |
|---|---|---|
| Starting Subscribers | 1,000 | 1,000 |
| Starting MRR | (Not needed for this calc) | $10,000 (at $10/subscriber) |
| Canceled Subscribers | 50 | 50 |
| Churned Revenue | (Not needed for this calc) | $500 (50 subscribers x $10) |
| Expansion Revenue | (Not needed for this calc) | $100 (from upgrades) |
| The Math | (50 / 1,000) x 100 | (($500 - $100) / $10,000) x 100 |
| Final Churn Rate | 5% | 4% |
As you can see, even a small amount of expansion revenue brought the Net Churn down from 5% to 4%. Those upgrades from your happy customers helped cushion the blow from the ones who left. This is a much healthier sign for your business.
The Power of Negative Churn
Now for the holy grail of subscription metrics: negative churn. This happens when your expansion revenue is greater than the revenue you lost from cancellations.
Let's imagine that instead of $100, your fitness app generated $600 in expansion revenue from users buying personal training add-ons. The calculation would look like this:
($500 Churned Revenue - $600 Expansion Revenue) / $10,000 Starting MRR x 100 = -1%
You've just hit a -1% Net Churn Rate. This is the ultimate proof of a sticky product with a strong value proposition. It means your business is growing from your existing customer base alone, without even counting a single new subscriber. That’s the engine for truly sustainable, long-term growth.
Diagnosing Why Your Customers Are Leaving
https://www.youtube.com/embed/_lOWKzn6mgE
Knowing your churn rate is like seeing a warning light pop up on your car's dashboard. It alerts you to a problem, but it doesn't tell you what the problem is. To actually fix the leak, you have to get under the hood and figure out what’s broken.
Most churn isn't random. It’s almost always tied to a specific breakdown in the customer journey where the value you promised just didn't show up. Finding those moments is the first real step toward building a subscription model that lasts.
Poor Onboarding Experience
Have you ever bought furniture that came with a terrible, confusing instruction manual? You get frustrated, give up, and maybe even return the whole thing. That’s exactly what a weak onboarding process does to your new users.
Those first few minutes inside your app are everything. If a new subscriber can't figure out how to get started and quickly experience that "aha!" moment, they're not going to stick around. A confusing interface, zero guidance, or just throwing every feature at them at once are sure-fire ways to send them running.
Key Insight: Onboarding isn't just a tutorial; it's your first and best chance to prove your app's worth. If users don't achieve something meaningful in their first session, the odds of them coming back plummet.
Mismatch Between Price and Value
Value is always in the eye of the beholder. When a subscriber decides to cancel, they’re doing some simple math in their head: "Is this service worth what I'm paying?" If the answer is no, they're out.
This value gap can pop up for a few different reasons:
- Confusing Pricing Tiers: Users have no idea what they actually get at each level.
- Gated Features: The one feature they really need is locked behind a pricey tier they can’t justify.
- Declining Perceived Value: The app feels stale, or a competitor is suddenly offering way more for less money.
The streaming wars are a perfect example of this. Despite having massive content libraries, price is still the number one reason people cancel. Recent data shows that 47% of former Netflix subscribers and 40% of Disney+ users pointed to high costs as the main reason they left. You can see more about how pricing drives streaming churn on fabricdata.com.
Technical Issues and Poor UX
Nothing kills trust faster than a product that just doesn't work. Slow load times, frequent crashes, and annoying bugs create so much friction that using your app feels like a chore. Every little glitch is another push toward that unsubscribe button.
And it’s not just about the big, catastrophic failures. Small, nagging issues with the user experience (UX) can be just as deadly over time. Think about a clunky interface, navigation that makes no sense, or a payment process that fails without explaining why. These problems send a clear message: we don't care about your experience. A smooth, reliable app isn't a luxury; it's the bare minimum.
Weak Product-Market Fit
Sometimes, the reason for high churn is more fundamental. You could have a beautiful, bug-free app with a killer onboarding flow, but if it doesn’t solve a real, nagging problem for the right people, they won't stay. This is the classic issue of a weak product-market fit.
This usually happens when:
- The problem you solve isn't a top priority for your target audience.
- Your solution is only a tiny bit better than what they're already using.
- You're marketing to the wrong people in the first place.
Figuring this out means you have to talk to your customers—both the happy ones and the ones who left. Sending out exit surveys and doing one-on-one interviews are crucial for understanding why people are really canceling and whether your product is truly hitting the mark. For a deeper look, check out our guide on the top subscription cancellation reasons and how to address them.
Actionable Strategies to Cut Customer Churn

Knowing why users are leaving is one thing, but actually stopping the bleeding is where the real work begins. Once you’ve diagnosed the leaks in your subscription funnel, you need a practical toolkit to plug them. This isn’t about throwing spaghetti at the wall; it’s about implementing proven tactics that reinforce your app's value from day one.
The goal is to stop being reactive—only paying attention to users when they hit "cancel"—and start being proactive. That means optimizing every single touchpoint, from the first time a user sees your paywall to the moment they might consider leaving. By focusing on these critical moments, you can make a serious dent in your churn rate subscription metrics.
Nail Your Paywall and Trial Experience
Think of your paywall as the front door to your business. If it’s confusing, unappealing, or just plain bad at communicating value, potential subscribers will turn around and walk away. A high-converting paywall is clean, direct, and laser-focused on the benefits a user will get, not just a list of features.
Your free trial is your best shot at getting a user hooked. It’s not just a countdown to a credit card charge; it’s an extended, guided tour. Your entire mission during the trial is to race the user to their "aha!" moment—that magical point where they truly understand how your app solves their problem. Get them there before the trial ends, and they'll happily pay.
To make this crucial period count, here are a few things to try:
- Simplify the choice. Stick to a single, powerful call-to-action (CTA) to prevent analysis paralysis.
- Lean on social proof. Add testimonials, user counts, or review scores to build instant trust.
- Guide new trial users. Trigger in-app tutorials or tooltips to walk them through core features.
- Send value-packed emails. During the trial, send helpful tips or case studies that reinforce the app's benefits.
Build Intelligent Cancellation Flows
When a user clicks that "cancel subscription" button, it isn't always game over. Many are just on the fence, reacting to a temporary budget crunch, or maybe just curious about the process. A smart cancellation flow, often called a "churn-save" flow, is your last—and best—chance to understand their motives and offer a compelling reason to stay.
Instead of just showing a confirmation screen, this is your opportunity to ask why. Based on their answer, you can immediately present a targeted offer that addresses their specific problem.
The cancellation moment is a critical feedback opportunity disguised as a failure. A user telling you "it's too expensive" requires a completely different response than one who says "I'm not using it enough."
Here’s a simple way to structure a smart cancellation flow:
- Start with a quick exit survey. Ask for the primary reason they’re leaving using a few single-choice options.
- Respond with a tailored solution.
- Price Issue? Offer a temporary discount (25% off for 3 months) or a downgrade to a cheaper plan.
- Low Usage? Suggest pausing the subscription for 1-3 months instead of canceling for good.
- Missing Features? Link them to your public roadmap or a tutorial for a powerful feature they might have missed.
Tools like Nuxie let you build these conditional flows visually, so you can trigger the right offer based on user feedback without having to push a new app update.
Proactively Engage and Delight Your Users
Honestly, the best way to reduce churn is to make sure customers never even think about leaving. This requires consistent, proactive engagement that repeatedly demonstrates your app’s value and shows you’re invested in their journey. Don't wait for them to become disengaged before you remind them why they signed up.
This means communicating with purpose. Share exciting product updates, offer genuinely helpful tips, and celebrate their wins. Every positive interaction strengthens their bond with your product, making it that much harder to cut ties.
Here’s what proactive engagement looks like in practice:
- Announce new features with fanfare. Use in-app messages and emails to build excitement and drive adoption.
- Share success stories and case studies. Show users how others just like them are getting massive value from the app.
- Get personal. Go beyond just using their first name. Send messages triggered by their actual usage patterns and in-app achievements.
At the end of the day, reducing your churn rate subscription comes down to building a product that isn't just useful, but becomes an indispensable part of your users' lives. By nailing the first impression, intelligently managing the last, and consistently delivering value in between, you'll build a loyal subscriber base that powers sustainable growth for years to come.
How to Measure Your Churn Reduction Efforts

Putting a churn reduction strategy into practice without a way to measure its impact is like trying to navigate a ship without a compass. You’re definitely moving, but you have no clue if you're actually heading toward your destination. To turn retention from a game of chance into a reliable growth lever, you need to know what's working and what's falling flat.
The best way to do this is to think of your retention tactics as experiments. By isolating variables and tracking the results, you can confidently invest more in the strategies that actually improve your churn rate subscription metrics and cut the ones that don't. This data-first mindset is the only sustainable way to build a retention program that lasts.
A/B Testing Your Retention Strategies
A/B testing is the undisputed champion of measuring change. The idea is simple: show one version of an experience (the control, or "A" group) to a segment of users, and a different version (the variant, or "B" group) to another. By comparing how each group behaves, you can figure out which version is better at hitting your goal—in this case, getting more users to stick around.
You can run A/B tests on almost any retention effort you can dream up. For example:
- Paywall Designs: Does a paywall that screams "annual savings" convert better than one focused on the flexibility of a monthly plan?
- Onboarding Flows: Do users who get a step-by-step product tour in their first session have better long-term retention than those left to explore on their own?
- Cancellation Offers: Is a 30% discount more persuasive for a canceling user than an offer to pause their subscription for a couple of months?
The trick is to only change one significant thing at a time. If you test a new paywall design and a new price point at the same time, you’ll never know which change truly caused the outcome.
Using Cohort Analysis to See the Long-Term Impact
While A/B tests provide instant feedback, cohort analysis is how you uncover the long-term effects of your changes. A cohort is just a group of users who all signed up during the same period, like "January 2024 Signups."
Tracking the behavior of different cohorts over months lets you see if your efforts are truly paying off.
Let's say you rolled out a totally new onboarding flow in March. By comparing the retention curve of your "March Cohort" against the "February Cohort," you can see if these newer users are staying active longer. If the March group's churn rate is consistently lower every single month, you've got solid proof that your new onboarding is a winner.
This approach is much more revealing than just staring at your overall churn rate, which can be thrown off by all sorts of things. Cohort analysis isolates the impact of your product changes on specific user groups, giving you a crystal-clear picture of what's actually moving the needle. It's easily one of the most critical subscription business metrics you can track.
Essential Tools for Measurement and Attribution
Trying to track all this data manually is a recipe for a headache. Thankfully, the modern mobile tech stack makes it far easier to set up, test, and analyze your churn reduction initiatives. The right tools work in concert to give you a 360-degree view of the subscriber journey.
Here’s what a typical stack looks like:
- Subscription Management Platform: You absolutely need a tool like RevenueCat to act as a single source of truth for subscription data from the App Store and Google Play. It centralizes all the key events, like when a trial starts, converts to paid, or is cancelled.
- Product Analytics: Platforms like Mixpanel or Amplitude are where you'll do the deep dives. They let you perform detailed cohort analysis and see how user behavior inside your app correlates with long-term retention.
- Paywall and Campaign Orchestration: This is where a platform like Nuxie shines. These tools allow you to design, target, and A/B test different paywalls and churn-save flows on the fly, without having to ship a new version of your app. This dramatically cuts down your experimentation time.
When you integrate these systems, you create a powerful feedback loop. You can use Nuxie to launch a new cancellation offer, see its immediate save rate, and then jump over to your analytics platform to monitor the long-term retention of the subscribers you saved. This is how you build a scalable, data-informed strategy to keep your users happy and paying.
So, what's a good churn rate for your business? That's a loaded question.
A 5% monthly churn might be a reason to celebrate for a consumer mobile app, but it would be a five-alarm fire for an enterprise SaaS company. The truth is, there’s no single magic number. It all comes down to context.
A "good" churn rate is really about what’s sustainable for your business model, your industry, and how much it costs you to get a customer in the door (CAC). If your CAC is low, like in many consumer apps, you can stomach a higher churn rate. But if you have a long, expensive sales cycle for an enterprise product, you absolutely have to keep churn as low as possible to stay profitable.
Finding the Right Benchmark
Industry data shows just how wide the gap can be. Subscription apps that become part of a daily or weekly habit—think Business, Health & Fitness, and Productivity tools—naturally have better retention. They weave themselves into a user's routine, which makes them incredibly sticky.
On the other hand, categories driven by novelty, like Gaming and Media, often battle higher churn once the initial excitement fades. The numbers don't lie: recent reports from RevenueCat show that almost 30% of annual subscriptions get canceled within the first month. That first 30 days is a make-or-break window.
The bottom line is this: a "good" churn rate is one that allows your business to grow. It needs to be low enough that your Customer Lifetime Value (LTV) is comfortably higher than your Customer Acquisition Cost (CAC).
To really get this right, you need to know your numbers inside and out. Lowering churn means customers stick around longer, which directly boosts how much they're worth to your business over time. If you want to dive deeper into that relationship, we have a complete guide on the customer lifetime value calculation formula.
Ultimately, the goal isn't to chase some arbitrary industry average. It's to build a healthier, more resilient business by consistently improving your own churn rate, month after month.
Common Questions About Churn
Once you start digging into churn metrics, a few questions almost always pop up. Getting these details right is the difference between having raw data and having a real retention strategy.
Voluntary vs. Involuntary Churn: What's the Difference?
This is a big one. Voluntary churn is when a customer actively decides to cancel. They go into their settings and hit the "cancel subscription" button. It’s a conscious choice.
Involuntary churn, on the other hand, is completely passive. This happens when a payment fails because of an expired credit card, a bank decline, or insufficient funds. The customer often doesn't even know it happened. This silent killer can account for up to 40% of total churn, making it a massive—and often overlooked—opportunity to win back revenue.
How Often Should I Be Looking at My Churn Rate?
The right answer really depends on your business. For most B2C mobile apps with monthly plans, checking your churn rate on a monthly basis is perfect. It gives you a reliable read on customer health without getting bogged down by daily fluctuations.
If you're running a B2B SaaS with longer sales cycles or only offer annual plans, looking at churn quarterly or even annually usually makes more sense. This approach smooths out the noise and aligns better with how your customers actually use and buy your product.
Is It Actually Possible to Have Negative Churn?
Absolutely. In fact, it's the holy grail for any subscription app. Negative churn happens when the new revenue you get from your existing customers outweighs the revenue you lost from the customers who canceled.
Think of it this way: You lose $1,000 in a month from cancellations. But in that same month, your happy, loyal customers upgrade their plans or buy add-ons, generating $1,200 in new revenue. Your net revenue churn is -2%.
This means your business is actually growing without even adding new customers. It’s a powerful sign that you’ve built something people truly value and are willing to pay more for over time.
Ready to turn churn insights into action? Nuxie is an AI-powered paywall studio that helps you design, target, and test high-converting offers—from trial optimizations to churn-save flows—all without needing an app update. Find out more at https://nuxie.io.