Customer Lifetime Value Calculation Formula Explained
Unlock the customer lifetime value calculation formula. Learn practical methods to calculate CLV, improve retention, and drive real business growth.
Let's start with the most straightforward way to calculate customer lifetime value:
CLV = Average Purchase Value × Average Purchase Frequency × Average Customer Lifespan
This simple formula gives you a solid estimate of the total revenue you can reasonably expect from one customer throughout their entire time with your business.
Why This CLV Formula Is Your Starting Point
At its heart, the customer lifetime value (CLV) formula is all about shifting your perspective. It moves you away from just celebrating a single sale and gets you thinking about the long-term health and profitability of your customer relationships.
Getting a handle on this number is a game-changer for making smarter decisions across your business. It directly helps you answer some of the most critical questions you face:
- How much can I actually afford to spend to bring in a new customer?
- Which of my customer groups are the most valuable over the long haul?
- Are the things I'm doing to keep customers around actually paying off?
Understanding the Core Components
The beauty of this historical CLV formula is its simplicity. It’s popular because it’s built on data you probably already have sitting in your sales or analytics platforms. It boils down to just three key variables.
Here’s a quick look at the building blocks of this calculation.
Key Variables in the Simple CLV Formula
This table breaks down the essential components used in the standard historical Customer Lifetime Value calculation.
| Variable | What It Means | Example Data Point |
|---|---|---|
| Average Purchase Value (APV) | The average amount a customer spends in one transaction. | Your typical customer spends $75 per order. |
| Average Purchase Frequency (APF) | How often a customer buys from you in a set time (e.g., a year). | The average customer makes 4 purchases a year. |
| Average Customer Lifespan (ACL) | The average time a person remains an active, paying customer. | On average, a customer stays with you for 3 years. |
When you master these three inputs, you start to see the real story behind your revenue.
It's the difference between seeing a one-off $50 sale and recognizing the potential of a $1,500 long-term relationship.
This historical approach is one of the most widely used for a reason. Companies that get this right see tangible results. According to a Salesforce customer lifetime value report, businesses that consistently apply this formula see a 15% improvement in their retention strategies and a 12% boost in their targeted marketing ROI.
CLV doesn't exist in a vacuum, either. It’s a powerful metric that ties directly into other key performance indicators, which you can read more about in this guide to essential subscription business metrics.
Putting the Simple CLV Formula Into Practice
It's one thing to understand the theory behind the customer lifetime value calculation formula, but seeing it in action with real numbers is where it all starts to click. Let's walk through a practical scenario for a growing e-commerce store—we'll use a fictional online shop that sells artisanal coffee beans.
To figure out CLV, you first need to pull three key metrics from your sales data:
- Average Purchase Value (APV): This is your total revenue over a period (like a year) divided by the total number of orders in that same period.
- Average Purchase Frequency (APF): This is the total number of orders divided by the number of unique customers who made them.
- Average Customer Lifespan (ACL): This is the average length of time a customer sticks around and keeps buying from you.
This simple formula is a great starting point, and this visual really helps break down how the pieces fit together.
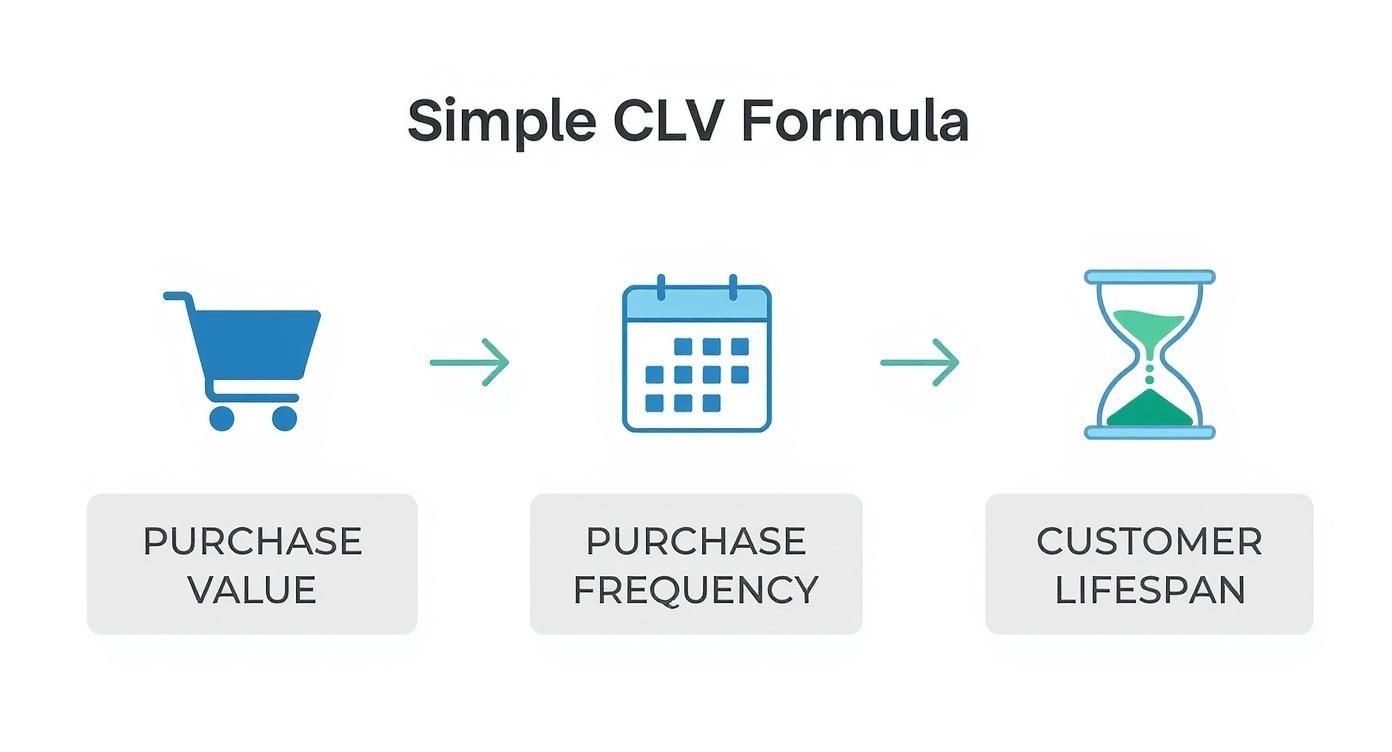
As you can see, each metric builds on the last to paint a complete picture of what a customer is truly worth over their entire journey with your brand.
Calculating CLV for the Coffee Shop
Let's dive into the numbers. After crunching last year's data, our coffee shop found the following:
- The Average Purchase Value is $50.
- Customers typically make 6 purchases per year, making that our Average Purchase Frequency.
- On average, a customer stays loyal for 3 years, giving us our Average Customer Lifespan.
With these figures in hand, we can plug them right into the simple CLV formula.
CLV = $50 (APV) × 6 (APF) × 3 (ACL) = $900
What does this $900 tell us? It means that, on average, we can expect each new customer to generate $900 in revenue over their entire relationship with our coffee shop. That single number is a game-changer for setting budgets, planning marketing campaigns, and forecasting growth.
From Revenue to Real Profit
But here’s a crucial point I always stress: revenue isn't profit. A much more powerful CLV calculation accounts for your actual profit margins. To get to this more realistic figure, we need to factor in your Gross Margin—the percentage of revenue you have left after subtracting the cost of goods sold (COGS).
Let's say our coffee shop has a healthy Gross Margin of 25%. Now we can refine our formula to find the profit-based CLV.
Profit-Based CLV = CLV × Gross Margin Profit-Based CLV = $900 × 0.25 = $225
This $225 is the number that truly matters. It's the actual profit an average customer brings into the business. Focusing on this profit-based figure helps you make much smarter financial decisions, especially when you're weighing marketing spend or analyzing other key metrics like your monthly recurring revenue calculation. Knowing this number is the difference between simply growing and building a truly sustainable, profitable business.
Moving Beyond the Basics with Predictive CLV
Relying solely on historical data is like trying to drive a car forward while only looking in the rearview mirror. It gives you a great picture of where you've been, but it’s a risky way to navigate what's ahead. This backward-looking approach assumes customer behavior will stay the same, which is a dangerous bet in today's fast-moving markets.
Predictive CLV, on the other hand, gives you a view through the windshield. It doesn't just replay the past; it helps you anticipate the future. By incorporating variables that reflect real-world business dynamics, it lets you forecast customer behavior with much greater confidence.
The Variables That Make Predictions Possible
So, what makes a predictive customer lifetime value calculation formula different? It’s all about the data you feed it. Instead of just looking at past purchases, these models bring in critical metrics that give you a much sharper picture of what's to come.
Two of the most impactful variables you’ll introduce are:
- Churn Rate: This is the percentage of customers who leave you during a specific period. By factoring in churn, you can realistically estimate how long a customer is likely to stick around, not just how long they've been with you so far.
- Discount Rate: This concept accounts for the time value of money—the simple fact that a dollar today is worth more than a dollar a year from now. Applying a discount rate gives you a more accurate, real-world valuation of future revenue.
When you weave these elements into your calculations, CLV transforms from a simple historical report card into a powerful financial forecasting tool. It's no longer just about past revenue; it's about projecting growth, accounting for customer attrition, and understanding the true value of future cash flow.
In fact, for businesses with recurring revenue models like SaaS or digital subscriptions, predictive models have been shown to boost forecast accuracy by up to 30% over traditional methods. You can find more details on different CLV models on bloomreach.com.
Think about it this way: a historical model sees two customers who each spent $500 last year as identical. But a predictive model might show that one has a 90% probability of staying with you, while the other is a churn risk with only a 40% chance of returning. Now you know exactly where to focus your retention budget for the biggest impact.
How Cohort Analysis Sharpens Your CLV Insights
A single, company-wide CLV is a decent starting point, but the real magic happens when you get granular. This is where cohort analysis enters the picture. It’s a powerful way to segment customers into groups based on when or how they first started doing business with you.
Think of a cohort as a specific "class" of customers. It could be everyone who signed up in January, or all the users you picked up from a specific holiday campaign. Analyzing these groups individually uncovers far richer insights than a simple, blended average ever could.
This approach blows a basic customer lifetime value calculation formula out of the water. Instead of relying on averages, you get a clear picture of how different acquisition strategies actually perform over the long haul. In fact, companies using cohort-based CLV models have seen a 25% higher accuracy in pinpointing their most valuable customer groups. For a deeper dive, check out these customer segmentation strategies on owox.com.
Uncovering Hidden Value in Your Data
Let’s say your e-commerce store runs two big acquisition efforts: one focused on organic search and another built around a massive Black Friday promotion. Your overall CLV might look perfectly healthy, but cohort analysis could tell a completely different story.
When you split them up, you might find:
- Organic Search Cohort: These customers tend to have a lower initial purchase value, but they stick around for a long time and make repeat purchases. Their loyalty drives their CLV up to an impressive $1,200.
- Black Friday Cohort: This group floods in, spends a lot upfront to snag a deal, and then disappears. They rarely come back, resulting in a much lower CLV of only $250.
Seeing this level of detail changes everything. You instantly realize that a customer from organic search is worth almost five times more to your business than a one-off discount-seeker.
Armed with that knowledge, you can start making smarter decisions with your marketing budget. You might decide to double down on your SEO and content strategy, knowing it attracts your most profitable long-term customers, instead of just burning cash on deep discounts for fleeting, low-value buyers.
Turning CLV Calculations into Business Growth
Figuring out your CLV is one thing, but the real magic happens when you start using that number to drive your strategy. It’s how you turn a simple metric from the customer lifetime value calculation formula into a powerhouse for smart, sustainable growth.
With this insight, you can finally stop guessing. You’ll have the data to back up tough decisions and can confidently put your resources where they’ll actually make a difference long-term.
Optimize Marketing Spend and Acquisition
Right away, your CLV can show you where your marketing budget is (and isn't) working. Once you know which channels deliver customers who stick around and spend more, you can cut the cord on campaigns that only attract low-value, one-and-done buyers.
Let’s say you discover that customers who find you through organic content have an average CLV of $1,500. At the same time, customers from your paid social ads top out at just $400. That’s a clear signal to double down on your content and SEO efforts. Even if the initial customer acquisition cost (CAC) is a bit higher, the payoff is massive. A healthy CLV to CAC ratio is typically around 3:1—this ensures you're actually profiting from your acquisition spend.
This shift isn't just about saving money—it's about investing in the right kind of growth. You're actively prioritizing customer relationships that fuel your business for years, not just a single quarter.
Inform Retention and Product Strategy
CLV data is also a goldmine for your retention efforts. It helps you identify your most valuable customers, the ones who truly deserve the white-glove treatment. From there, you can design targeted campaigns to keep them happy and engaged.
This could look like a few different things:
- Loyalty Programs: Roll out exclusive perks or early access to new features for your most profitable customer groups.
- Proactive Support: Offer priority assistance to make sure their experience is always smooth and positive.
- Personalized Communication: Ditch the generic emails and tailor your messaging to show them you understand their needs and appreciate their business.
At the end of the day, a laser focus on boosting CLV directly strengthens your bottom line by keeping your best customers from walking away. If you're looking for more ideas, you can learn how to reduce churn and keep your MVPs loyal.
Answering Your Top Questions About CLV
Even when you've got the basic customer lifetime value formula down, a few practical questions almost always pop up once you start digging into your own numbers. Let's walk through some of the most common ones I hear, so you can start using this metric with confidence.
How Often Should I Calculate CLV?
There’s no one-size-fits-all answer here; it really depends on the rhythm of your business.
For most e-commerce and retail brands, running the numbers quarterly or twice a year is a great cadence. It's frequent enough to spot meaningful trends and see how major marketing pushes are paying off, but not so often that you get bogged down by tiny, insignificant blips.
On the other hand, if you're running a subscription business like a SaaS platform, you’ll want to look at CLV more often—monthly, or at the very least, quarterly. This gives you a much clearer, real-time pulse on things like churn and the impact of your retention efforts on that all-important recurring revenue.
What Is a Good CLV to CAC Ratio?
The magic number everyone aims for is a 3:1 ratio of CLV to Customer Acquisition Cost (CAC).
Think of it this way: for every dollar you spend to get a new customer, you should be getting at least three dollars back over their lifetime. If your ratio is 1:1, you're essentially breaking even on marketing spend before you even account for the cost of goods or running your business—a fast track to losing money.
But if you see a ratio of 4:1 or 5:1? That’s a fantastic sign. It tells you your business model is incredibly healthy and that you probably have an opportunity to spend more aggressively on growth without taking on too much risk.
A 3:1 ratio is the sweet spot. It confirms your acquisition strategy is both profitable and sustainable, giving you a solid foundation to build on.
Can I Calculate CLV Without Historical Data?
It’s tough, but definitely not a deal-breaker. If your business is brand new and you don't have a long history of customer data, you have to start with educated guesses based on industry benchmarks.
You'll need to do a little research to find typical numbers in your specific niche for:
- Average order value
- How often customers tend to buy
- The average customer lifespan
This gives you a reasonable starting point for your initial projections. The key is to treat these as temporary placeholders. As soon as you start gathering your own real-world data, swap out those estimates with your actual figures. This will make your CLV calculation increasingly accurate and more valuable over time.
Ready to turn insights into action? Nuxie helps iOS developers design, target, and ship high-converting paywalls in minutes, empowering you to boost your app's CLV. Learn more at nuxie.io.